This version of the online catalogue is taken from an article in preparation by Međugorac et al. The online catalogue was created by Iva Međugorac, Karla Jambrošić, Domagoj Dolički, Josipa Kuzmić, Jadranka Šepić, Iva Vrkić and Goran Gašparac, and is regularly updated with the latest events as meteorological and sea-level data become available.
The catalogue is based on hourly sea-level measurements at the Bakar station (Međugorac et al., 2022; Međugorac et al., 2024) provided by the Department of Geophysics, Faculty of Science, University of Zagreb (Croatia). The analysis of the sea-level measurements is supplemented by the analysis of atmospheric synoptic conditions during all events. For earlier flood episodes (before 1 January 1950), the analysis of meteorological background was performed using the NOAA-CIRES-DOE Twentieth Century Reanalysis Project version 3 dataset (Slivinski et al., 2019). For all other episodes, we used the global ERA5 reanalysis dataset (C3S, 2017; Hersbach et al., 2020).
In order to investigate the effects of the floods, nine titles of serial publications in printed or microfilmed form in the National and University Library were examined: Hrvatski dnevnik, Jutarnji list, Narodne novine, Novi list, Obzor (Zagreb, 1920), Primorske novine, Slobodna Dalmacija, Večernji list and Vjesnik.
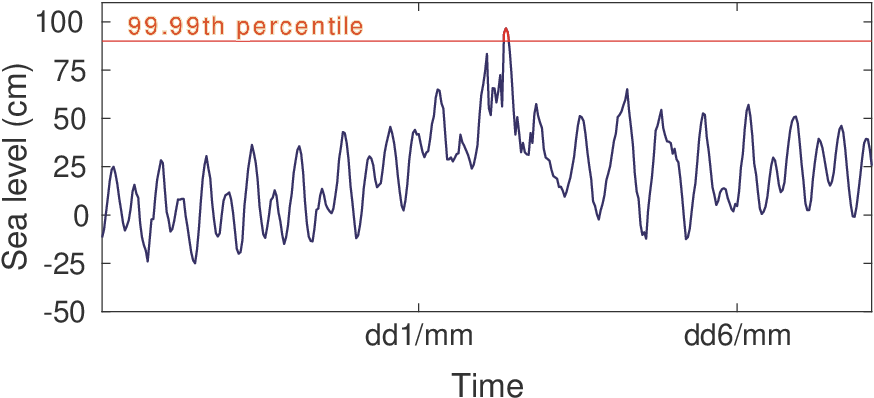
Extreme sea-level episodes were defined as occasions when the measured sea level exceeded the 99.99th percentile threshold (89 cm for 1929–2022) (example in Figure 3). Consecutive sea levels that exceeded the given threshold were combined into one event, which is represented by the maximum sea level reached during that event. All values are given above the mean sea level (73.8 cm) calculated over a period of 18.6 years around 1971.5 (1962–1980; HVRS71 national geodetic system; Rožić, 2009).

Figure 5. Example of a recorded extreme sea-level episode. The measured hourly sea level is shown with the blue curve, the 99.99th percentile threshold corresponding to a level of 89 cm (calculated for 1929–2022) is shown with the horizontal red line.
Acknowledgments
We would like to recognize the work of many people who have looked after the Bakar tide-gauge station over many decades. Harbor masters in Bakar as well as scientists and technicians from Department of Geophysics were involved in the maintenance of the station/instruments and data processing. We are grateful to the former heads of the station, Profs J. Goldberg and K. Kempni (from 1929 to 1939), Prof. M. Kasumović (from 1949 to 1983) and Prof. M. Orlić (from 1984 to 2023).